library(tidyverse)

# A reproducible example of the data (after extraction)
# this mimics what the parsing script would produce

fake_reflections <- tibble::tribble(~task, ~feeling_score, ~enjoyment, ~skill,
                                    "Wrote a difficult email", 5, 4, 6,
                                    "Gave Tidyverse workshop", 7, 9, 10,
                                    "Debugged failing script", 4, 8, 9,
"Organized project files", 6, 7, 8)Note-Taking is more powerful than you think (1/2)
PKM
note-taking
Part 1 of 2 - This post shows how I transformed simple daily work logs in Logseq into a powerful data visualization in R to better understand my own strengths and interests.
The PPP (Post PhD Panic)
It was January. I had finished my PhD the previous November and, after taking all of December off for a much-needed (and probably longer than it should’ve been) holiday, I started the new year with a slow-dawning realisation.
I guess it could be summarised in: “and now, what?”.
Despite a well documented history of growth (I was a doctor for crying out loud!), I couldn’t clearly answer two simple questions: What am I actually good at? And what do I enjoy doing?
The paralysis was real. I could list my accomplishments, but they felt like monolithic blocks. “I wrote a dissertation” could be a great conversation starter, but it’s not necessarily clear what that entails.
Take, for example, “writing a scientific article”. It’s a huge part of academic life, but do I like it? Am I good at it?
The question itself is flawed because the task is too broad. “Writing an article” is a galaxy of smaller tasks: data collection, writing a draft, collaborating back-and-forth with co-authors (do they even read my innumerable emails at some point?), documenting everything because I forget what I am doing 3 hours later, making figures, endless reviews (spoiler alert: I hate that part). Is it possible to assign a single score for enjoyment or skill to “writing an article”?
So I decided to try a simple weekly review: every Friday, I’d sit down and try to reflect on my work week. Which tasks did I do? Did I like doing them? Was I skilled enough?
The reality? When I finally sat down with my thoughts I could barely remember a single task from the previous five days. I knew I had been busy, I knew I had worked, but when I tried to recall what I’d actually done, my brain just filled with static. It was as if the entire week had passed in a blur with no imprints on my memory.

That’s when it hit me: I’ve spent years taking notes on things in Logseq. If I can take notes on everything else, why not on my own work? That’s when I decided to turn my note-taking flow inward, and build a system for getting to know myself better.
“We Need Clay!” (or: my citations are always messed up)
You know how Sherlock Holmes said, “Data! Data! Data! I can’t make bricks without clay”?
Well, I didn’t. I had to google it because my brain had somewhat summarized it in “I need clay!”, which didn’t make much sense when I wrote it down. I blame my internal Italian-to-English translator.
Either way, as a good scientist, I knew I needed data.
I decided to stick with Logseq for many reasons.
First of all, I love Logseq.
Secondly, I spent years building a routine of note-taking, so I could just add an additional step. Logseq was the hub for my PhD research, it is where I plan these blogpost, my work tasks and anything important in my life. But one thing is to write things down and another one is to read them again and do something with them (more on this topic coming soon, stay tuned for Part 2 on this note-taking blogpost series).
When I started this “project” I had a very loose plan. The first important rule was to put all the entries together. I chose the tag #SelfReflection (mostly because #journaling was already taken for other things).
In the project page, I tried to summarize the plan it in few bullet points:
NotePhases
Data collection: I need data to work with. Record the tasks or activities done throughout the week and write down how I feel about them, but also if I feel skilled at them or not.
- Mandatory: Write down small and specific tasks. For example, instead of “wrote article” say “wrote 200-word paragraph about the function of AQP4”
Review: After the week is over, check the entries in Logseq for recurrent patterns. For example, things that weren’t real tasks, but did them because I wanted to, needed to, or enjoyed it.
Create keywords from the data: Having specific tasks I enjoy/am good at, I can now extract skills.
- E.g., “I like explaining concepts visually” → “Visual Communication, Science Communication”
- E.g., “I enjoy breaking down complex topics” → “Content Structuring, Information Design”
- E.g., “I love to create systems for organizing data” → “Knowledge Management”
Rinse and repeat
As you can see, my initial system was quite simple.
And, as you might have noticed, I already left you with a spoiler: after a few weeks I edited the first point to remind myself that too broad tasks were not the point. But that’s the good thing about trying a system, you can always improve it!
For Version 1.0 I created a template that I could call anywhere in my notes:
NoteVersion 1.0
- #SelfReflection
- Task:
- Feeling:
- Enjoyment:
- Skill Level:
To make this a real habit, I embedded this empty structure directly into my daily notes template in Logseq. Every morning as I was opening Logseq, it was there.
I won’t lie, the beginning was extremely difficult. I’m sure I’m not alone in this: you finish your workday, you’re mentally exhausted, but you cannot recollect what you actually did.
But it’s like meditation; everyone sucks at it at the beginning. With practice, the process became easier, and I got better at acknowledging the small tasks: “Today I wrote a difficult email, I felt super good about it, even if I wasn’t feeling very skilled.” Done. One data point.
For a while, this worked. Then, a new kind of excitement took hold. I wasn’t just journaling anymore; I was building a dataset.
Mindblowing sound.
And if you have a dataset… you have to plot it. I think it’s a law somewhere, look it up.
This decision to move my notes into R for analysis was the turning point that exposed every flaw in my simple little system.
The Roadblocks in R
After a few months, I had a reasonable amount of data and was ready to make the jump to R. To make this journey reproducible for you, I’ll use a small, fake dataset that perfectly mirrors the structure of my real data (for the whole workflow, check the last section!):
The first problem was immediately obvious. I should have seen this coming. My Task descriptions were unique and messy, with no repeatable patterns: great for a human reader but useless for aggregation.
This led to the first iteration: creating a Tag field for consistent taxonomy for my work.
This meant exactly what you are thinking: going back to all my entries and add meaningful tags.
Yuppi, she said sarcastically.
NoteVersion 2.0
- #SelfReflection
- Task:
- Feeling:
- Enjoyment:
- Skill Level:
- Tag:
library(tidyverse)
# Same fake data, but with tag as well

fake_reflections <- tibble::tribble(~task, ~feeling_score, ~enjoyment, ~skill, ~tag,
                                    "Wrote a difficult email", 5, 4, 6, "writing",
                                    "Gave Tidyverse workshop", 7, 9, 10, "presentation; mentoring",
                                    "Debugged failing script", 4, 8, 9, "coding",
                                    "Organized project files", 6, 7, 8, "organisation; project management")
Nice! Now I can extract the information and plot it!
fake_reflections <- fake_reflections %>%
  separate_rows(tag, sep = "\\s*;\\s*") %>%
  mutate(tag = str_to_title(tag))

ggplot(fake_reflections, aes(x = skill, y = enjoyment, color = tag)) +
  geom_jitter(size=3)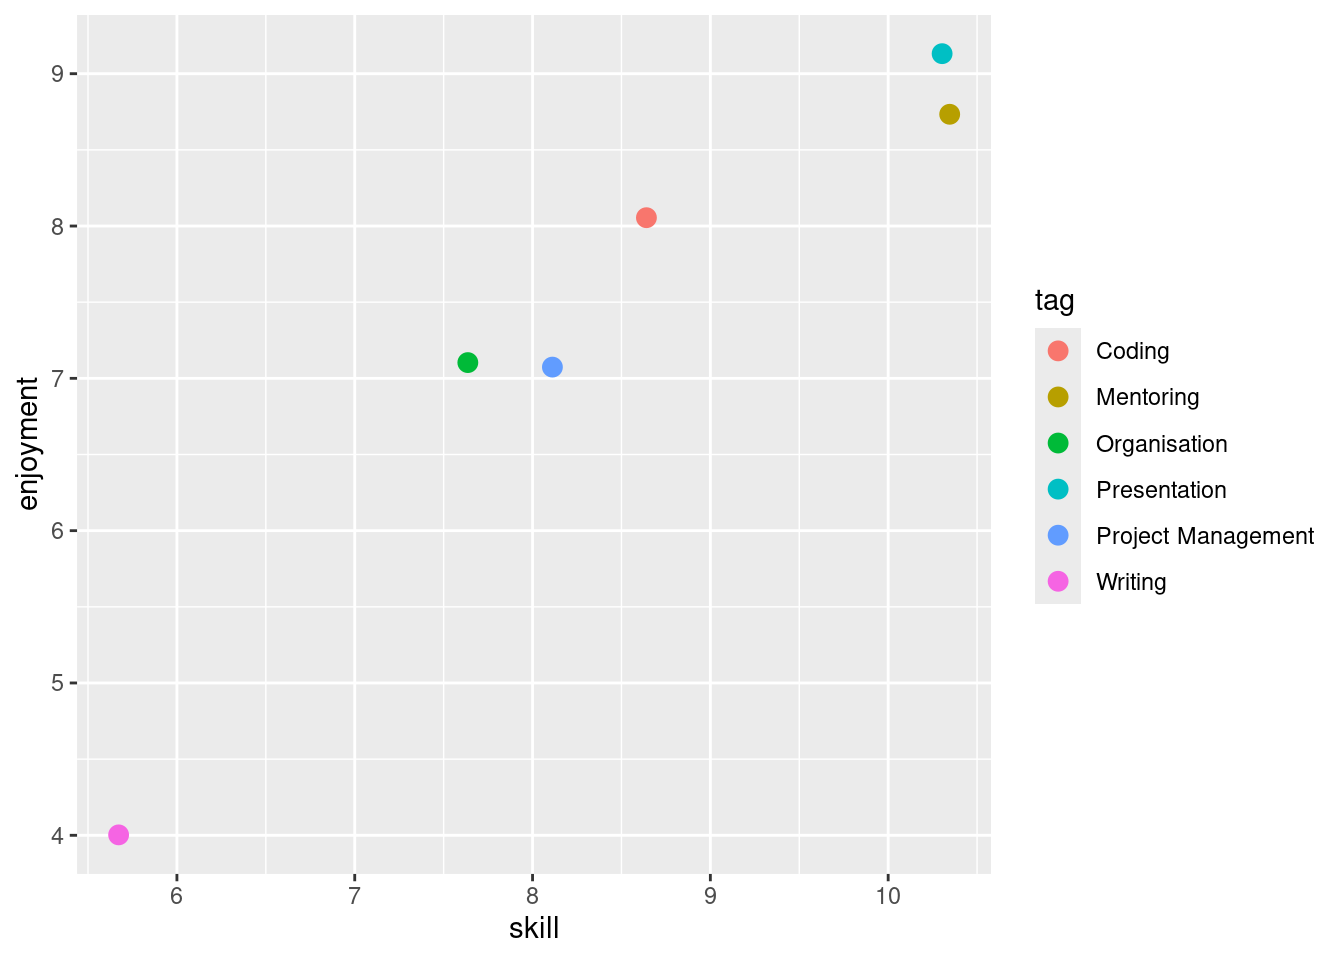
Oh. Wait a minute.
str(fake_reflections)tibble [6 × 5] (S3: tbl_df/tbl/data.frame)
$ task : chr [1:6] "Wrote a difficult email" "Gave Tidyverse workshop" "Gave Tidyverse workshop" "Debugged failing script" ...
$ feeling_score: num [1:6] 5 7 7 4 6 6
$ enjoyment : num [1:6] 4 9 9 8 7 7
$ skill : num [1:6] 6 10 10 9 8 8
$ tag : chr [1:6] "Writing" "Presentation" "Mentoring" "Coding" ...I had duplicate entries in my tibble! How?
Well, better data wrangling people would know already, but it took me a minute to discover the “problem” (if we want to call it problem).
I used multiple tags per task, thinking it would best capture my experience. If I am giving a workshop, it’s both “Mentoring” and “Presentation”, why choose? It is different than, for example, giving a presentation to a lab meeting. Mentoring could also be other things, like helping a student prepare with their application or interview. I was pretty happy with my recordings.
But when you run separate_rows(tag, sep = "\s*;\s*"), for every row with multiple tags (e.g. “Mentoring” and “Presentation”), it creates a new row per tag, duplicating all the other fields (task, feeling, etc.) for each tag. So, if a task has two tags, you get two rows (one for each tag, but all fields except tag are exactly duplicated). For three tags, three rows. For one tag, no duplication.
Aargh. What now? some entries, like the Gave Tidyverse workshop, were now duplicated, skewing my data. My clever system was an analytical headache. That real-world problem forced me back to the drawing board to weigh the trade-off between keeping this system (it’s not that bad) or clarity.
I considered a few options:
- Keep the multiple tags and duplicated rows.
- Force myself to choose only one primary tag per task.
- If a task truly had multiple facets, break it into smaller, single-tag tasks.
- Add a
Tag2field for secondary tags.
I can see the pro and cons for all options. I wondered about what to do. The reason why I wrote it all here it’s because, ultimately, the best option for me could not be the best option for someone else. This is the beauty of Personal Knowledge Management (PKM): “what works for me might not work for you”.
The key is to find a system that serves your analytical goals. Do you mind the multiple rows? Maybe not. I can see a use of it: for example if you want to see which Tags are often paired together, and if they are often associated with high enjoyment score.
But I am not so interested in that, so I chose option 3. It forced me to be more specific about what I was actually doing. If I couldn’t choose a single tag, the task was probably too big anyway.
Defining what matters
With my tagging system refined, I was ready. But then I hit my nth roadblock, and I realized I wasn’t.
Namely, I looked back at my data and realized I was using Feeling and Enjoyment interchangeably. That is not a good sign. There was a reason I created two fields, but what was that again? And why didn’t I write it down?
I had to pause and create distinct definitions for myself:
Note
Feeling: What was my emotional state during or just after the task? This is about the immediate mood (e.g. energized, frustrated, proud, anxious). It can be influenced by deadlines or context.
Enjoyment: Did I actually like the task itself? e.g. you can feel accomplished after a task you found profoundly boring.
Here’s how the (my) distinction plays out:
- You might feel stressed while troubleshooting code (Feeling: “anxious, challenged”), but deeply enjoy the problem-solving (Enjoyment: 8/10).
- You might feel calm while doing mundane admin work (Feeling: “relaxed”), but find it intensely boring (Enjoyment: 2/10).
This clarification fundamentally improved my data. I started noticing tasks where my Feeling was low but Enjoyment was high. For example, I often felt anxious before a presentation (Feeling score: 3/10), but I consistently rated my Enjoyment of the act of presenting as very high (9/10). This simple distinction revealed that some of the activities that are most rewarding for me are also the ones that push me out of my comfort zone. In this case, I maintained Feeling as a numerical score, but I introduced a categorical tag alongside it:
library(tidyverse)

fake_reflections <- tibble::tribble(~task, ~feeling_score, ~feeling_text, ~enjoyment, ~skill, ~tag,
                                    "Wrote a difficult email",  5, "focused", 4, 6, "writing",
                                    "Gave Tidyverse workshop",  3, "anxious", 9, 10, "presentation",
                                    "Debugged failing script",  4, "challenged", 8, 9, "coding",
                                    "Organized project files",  7, "productive", 7, 8, "project management")
This is still a working system. I am not sure yet what do I want to prioritize: the numerical score or the categorical tag, or perhaps find a way to integrate both. I need more data collection before making a decision. But ehi, that’s exactly what I love about taking notes! It’s like this system that’s always growing and getting better as I figure things out more about my own experiences.
A system for self-knowledge (and what’s next)
This whole process taught me a crucial lesson: building and refining the note-taking system was the self-reflection. The journey of wrestling with my messy data forced me to define what I do, how I categorize my work. And in the end, I finally got my plot!
library(tidyverse)

# A more thorough fake dataset

reflections_final <- tibble::tribble(~task, ~enjoyment, ~skill, ~tag,
  "Gave Tidyverse workshop", 9, 10, "Presentation",
  "Debugged a complex script", 8, 9, "Coding",
  "Mentored a junior colleague on their project", 9, 8, "Mentoring",
  "Outlined a new blog post idea", 8, 7, "Writing",
  "Designed a data visualization", 9, 9, "Coding",
  "Automated a boring report with a script", 10, 8, "Coding",
  "Addressed reviewer comments (round 3)", 2, 9, "Writing",
  "Formatted citations for a paper", 3, 10, "Admin",
  "Answered 50 emails in one afternoon", 4, 8, "Admin",
  "Chased co-authors for manuscript feedback", 2, 7, "Project Management",
  "Wrote detailed project documentation", 5, 8, "Writing",
  "Learned a new ggplot extension", 8, 4, "Learning",
  "First attempt at a simple Shiny app", 9, 5, "Coding",
  "Networking at a conference", 7, 5, "Networking",
  "Trying out a new note-taking method", 8, 3, "PKM",
  "Recording a short tutorial video", 7, 4, "Presentation",
  "Manually copied data from PDF to Excel", 1, 3, "Data Entry",
  "Sat through a mandatory, irrelevant meeting", 2, 2, "Meetings",
  "Troubleshot a printer connection issue", 1, 1, "Admin",
  "Filled out travel reimbursement forms", 3, 4, "Admin",
  "Unsuccessfully tried to configure a server", 2, 3, "Coding")

# The ggplot code remains the same

ggplot(reflections_final, aes(x = skill, y = enjoyment, color = tag)) +
  geom_jitter(size = 4) +
  labs(x = "Skill Level", y = "Enjoyment",
    color = "Task Type") +
  scale_x_continuous(limits = c(0, 10), breaks = seq(0, 10, 2)) +
  scale_y_continuous(limits = c(0, 10), breaks = seq(0, 10, 2)) +
  geom_hline(yintercept = 5, linetype = "dashed", color = "gray50") +
  geom_vline(xintercept = 5, linetype = "dashed", color = "gray50") +
    annotate("text", x = 7.5, y = 7.5, label = "Zone of Genius", color = "gray20", fontface = "bold") +
  annotate("text", x = 7.5, y = 2.5, label = "Burnout Zone", color = "gray20", fontface = "bold") +
  annotate("text", x = 2.5, y = 7.5, label = "Growth Zone", color = "gray20", fontface = "bold") +
  annotate("text", x = 2.5, y = 2.5, label = "Toil Zone", color = "gray20", fontface = "bold")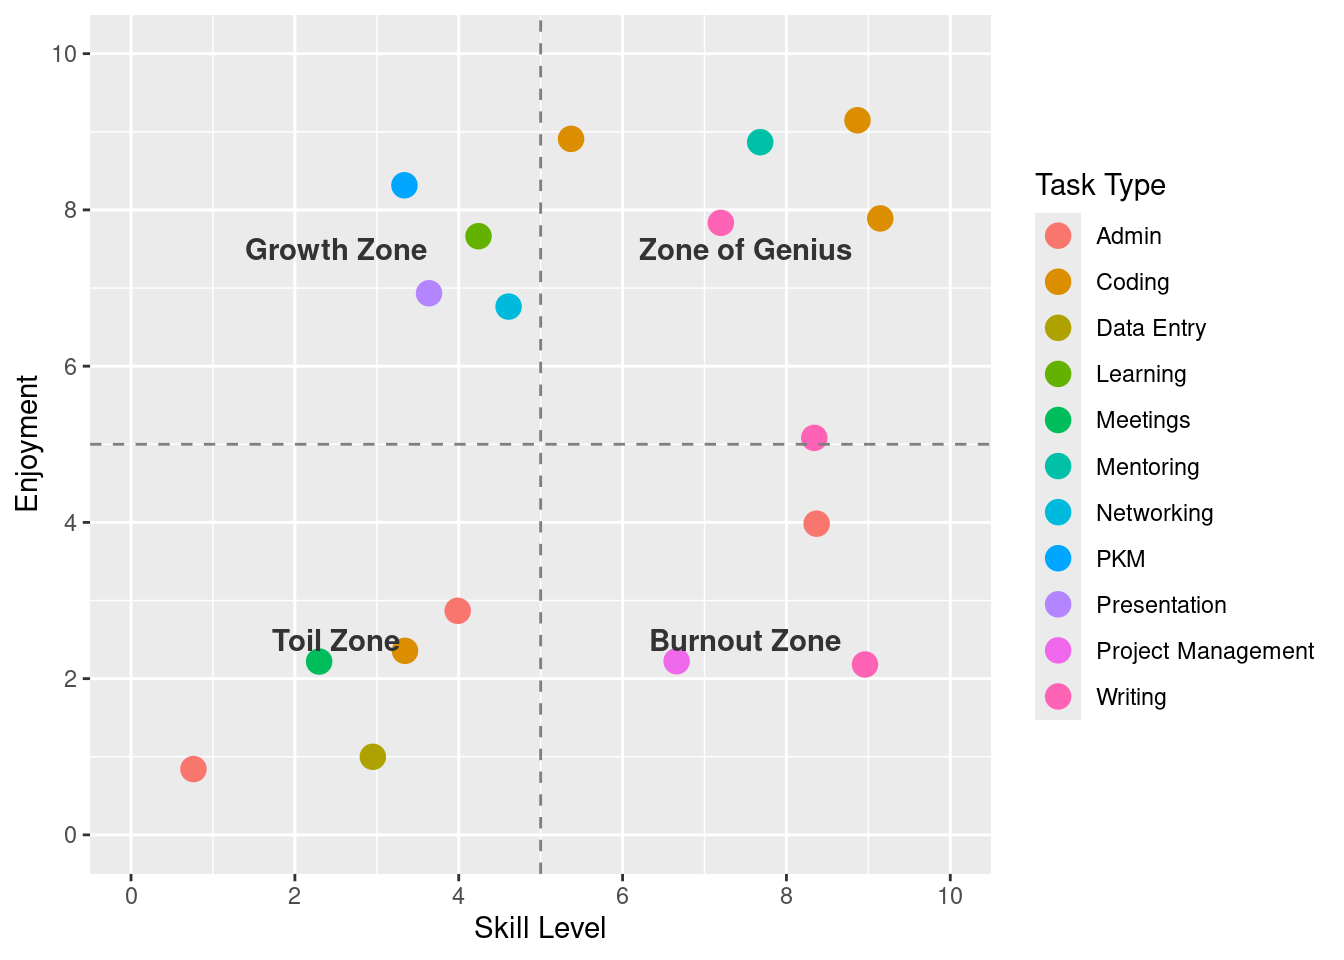
This simple scatter plot is a map of my professional self.
- My Zone of Genius (High Skill, High Enjoyment): For me, this is where Coding, Presentation, and Mentoring live.
- The Burnout Zone (High Skill, Low Enjoyment): Things I’m good at but drain me.
- The Growth Zone (Low Skill, High Enjoyment): Things I love and should invest more time in.
- The Toil Zone (Low Skill, Low Enjoyment): Tasks to minimize/delegate/automate.
That’s it. This journey gave me a powerful quantitative map of my skills and passions.
But what about the stories hidden in the unstructured text of my daily notes? What themes and patterns emerge when I’m not scoring and tagging, but just writing?
That’s a story for another time. In Part 2, we’ll leave the numbers behind and venture into the world of text mining to see what other secrets my Logseq vault is waiting to tell me.
TL;DR
- Motivation: To overcome post-PhD uncertainty, I needed to understand what work tasks I was good at and what I genuinely enjoyed.
- Method: I used a daily template in Logseq to systematically record my work tasks, rating each on a 1-10 scale for Skill Level and Enjoyment, and adding descriptive Tags.
- Iteration: Moving this data to R for visualization revealed flaws in my system. I had to refine my process by breaking down large tasks, solving a data-duplication issue caused by multiple tags, and creating clear definitions for my metrics (like Feeling vs. Enjoyment).
- Payoff: The result is a scatter plot that visually maps my professional self into four key zones (e.g., “Zone of Genius”), providing clear data on my career preferences.
- Core Lesson: The act of building and refining a personal tracking system is, in itself, a powerful form of self-reflection. The messy process is where the real learning happens.
For the adventurous: the full R Parsing script
Here is the function I use to extract the structured data from my Logseq journal files. You can adapt it for your own vault/folder.
# Helper to safely extract a regex group
extract_field <- function(lines, pattern) {
  match <- str_match(lines, pattern)
  if (!is.null(match) && nrow(match) > 0) match[, 2] else NA_character_
}

extract_reflections <- function(file) {
  lines <- readLines(file, warn = FALSE)
  entries <- list()
  inside_block <- FALSE
  current_block <- c()

  for (line in lines) {
    if (grepl("^- +#SelfReflection", line)) {
      if (length(current_block) > 0) entries <- append(entries, list(current_block))
      current_block <- c(line)
      inside_block <- TRUE
    } else if (inside_block) {
      if (grepl("^\\s+", line)) {
        current_block <- c(current_block, line)
      } else if (line == "" || grepl("^- +[^#]", line)) {
        entries <- append(entries, list(current_block))
        current_block <- c()
        inside_block <- FALSE
      }
    }
  }
  if (length(current_block) > 0) entries <- append(entries, list(current_block))

  map_dfr(entries, function(entry) {
    task_line <- entry[grepl("\\*\\*Task\\*\\*:", entry)]
    feeling_line <- entry[grepl("\\*\\*Feeling\\*\\*:", entry)]
    enjoyment_line <- entry[grepl("\\*\\*Enjoyment\\*\\*:", entry)]
    skill_line <- entry[grepl("\\*\\*Skill Level\\*\\*:", entry)]
    tag_line <- entry[grepl("\\*\\*Tag\\*\\*:", entry)]

    task <- extract_field(task_line, "\\*\\*Task\\*\\*: *(.*)")
    feeling_score <- as.numeric(extract_field(feeling_line, "\\*\\*Feeling\\*\\*:\\s*(\\d+)"))
    feeling_text <- extract_field(feeling_line, "\\*\\*Feeling\\*\\*:\\s*\\d+\\s*[-–—]\\s*(.*)")
    enjoyment <- as.numeric(extract_field(enjoyment_line, "\\*\\*Enjoyment\\*\\*: *(\\d+)"))
    skill <- as.numeric(extract_field(skill_line, "\\*\\*Skill Level\\*\\*: *(\\d+)"))
    tag <- extract_field(tag_line, "\\*\\*Tag\\*\\*:\\s*(.*)")

    tibble(
      file = basename(file),
      task = task,
      feeling_score = feeling_score,
      feeling_text = feeling_text,
      enjoyment = enjoyment,
      skill = skill,
      tag = tag
    )
  })
}


# To run it yourself:
# logseq_path <- "/path/to/your/Logseq/journals"
# md_files <- list.files(logseq_path, pattern = "\\.md$", full.names = TRUE)
# reflections <- map_dfr(md_files, extract_reflections)